We live in a world of numbers. From the fiber of our DNA that makes us who we are, to the code that underlies computer programming, to the laws of the physical universe, and everything in between. The numbers exist with or without us; but in observing and analyzing these numbers we assign them meaning.
Meaning is at the core of business analysis, making it a vital aspect in growing any organization. Knowing how to use Excel for business analysis can help you start tracking and using your company’s data. As the worldwide standard for spreadsheet applications, Excel offers users a massive range of functions and features to assist in data collection, analysis, and visualization.
These functions are specifically designed to help users go beyond a general overview and dig into the true meaning behind the numbers. Mastering Excel and its wide variety of included tools can help organizations investigate and optimize performance, uncover new insights, and discover unique solutions to implement.
If you’d like to explore even more robust solutions, download Impact’s checklist, What Businesses Need for a Successful Business Intelligence Strategy featuring information on business intelligence tools, platforms, and strategies.
Sorting and Organizing Data
One of the most labor-intensive tasks in a business analysts’ week-to-week is data sorting and organization. To avoid the headaches involved in sifting and parsing your way through seemingly infinite data sets, you can make use of several lookup functions that are useful when using Excel for business.
The three main lookup functions to know when using Excel are VLOOKUP, Fuzzy Lookup, and Index Match.
VLOOKUP
VLOOKUP is an Excel function that allows users to find values in a data set or table by row. For instance, if a company wanted to look up an employee badge number based on their surname, they might make use of a VLOOKUP formula.
VLOOKUP is an Excel function that is typically learned early and is an incredibly useful tool. VLOOKUP makes retrieving information from simple datasets incredibly quick and easy. However, it requires a bit of precision as it won’t return similar results, only exact results. Not only that, but VLOOKUP formulas are sensitive to adding to or adjusting the data sets in use.
Fuzzy Lookup
This is where the Fuzzy Lookup function shines. Fuzzy Lookup works similarly to the VLOOKUP function but produces values that are close to one another. This can be incredibly helpful when you need to compare two or more data sets. It also helps with finding data points that might be missed due to human error somewhere along the process.
“With Fuzzy Lookup, you won’t have a hard time finding matches in different tables. Its algorithm uses a similarity index to return names that are similar but not exact matches.”
-Maximilian zur Muehlen-
Index Match
Finally, the third lookup function to familiarize yourself for business analysis with Excel in the workplace is the Index Match function. Using the index and match functions in concert in Excel allow users to build incredibly powerful lookup formulas that make parsing and finding specific data points incredibly easy.
Many Excel experts even believe that learning to use then Index and Match functions makes the VLOOKUP function somewhat obsolete. This is because the Index Match function offers more versatility and flexibility in its use. For instance, when conducting a VLOOKUP if the user wants to include additional columns, they must reset the parameters for the formula entirely.
With the Index Match function, on the other hand, users can add columns to and modify data sets without worrying about breaking their formulas.
This guide will take you through some of the specific syntax needed to write powerful lookup formulas in Excel.
PivotTables
PivotTables are extremely useful in Excel and data analysis for businesses. A PivotTable is a dynamic visualization that summarizes larger data sets based on what the user wants to see. As you can imagine, this makes it easy and convenient to summarize, analyze, compare, and view data in completely new ways.
PivotTables are also one of the most user-friendly tools in Excel as they allow for hyper flexibility in working with large data sets. Additionally, users can utilize PivotTables to perform calculations on the data or organize it to be visualized even further.
PivotTables are used in all sorts of unique ways in order to display, present, and create meaning out of valuable raw data.
Becoming a master at Excel PivotTables takes some learning and practice but is well worth the invested time. Starting off by understanding some of the best practices for creating high-quality PivotTables will help you generate major insights through the tool right out of the gate.
A few PivotTables best practices include:
- Planning the data you want measured.
- Cleaning up the source data.
- Formatting data fields at the source rather than in the display table.
Creating PivotTables with a clear intention will help in deciding which data to include. Clean source data makes it easier to validate the information being used to create the PivotTable. And refraining from formatting data in the presentation table will help you avoid breaking the formula for your PivotTable and having to start from scratch.
Data Visualization
When it comes down to it, data visualization is unbelievably helpful in understanding metrics, telling a story, and discovering insights into operations. Business analysts at all levels need to be able to highlight and emphasize important statistics, recurring patterns, and other trends that may otherwise go completely unnoticed by decision makers and organizational leaders.
After all, it’s exactly those statistics and trends that lead to the insights executives need to make revolutionary changes in their companies.
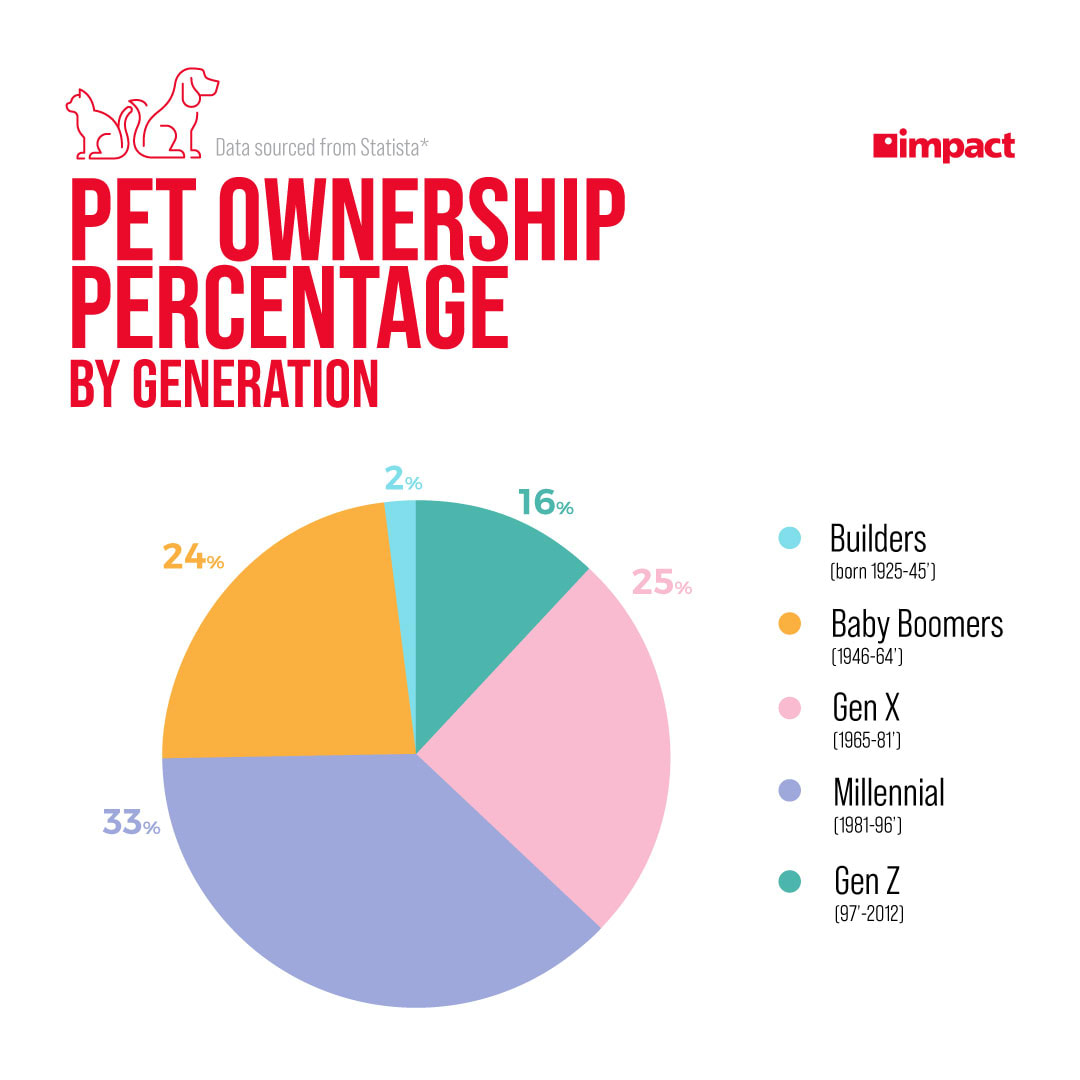
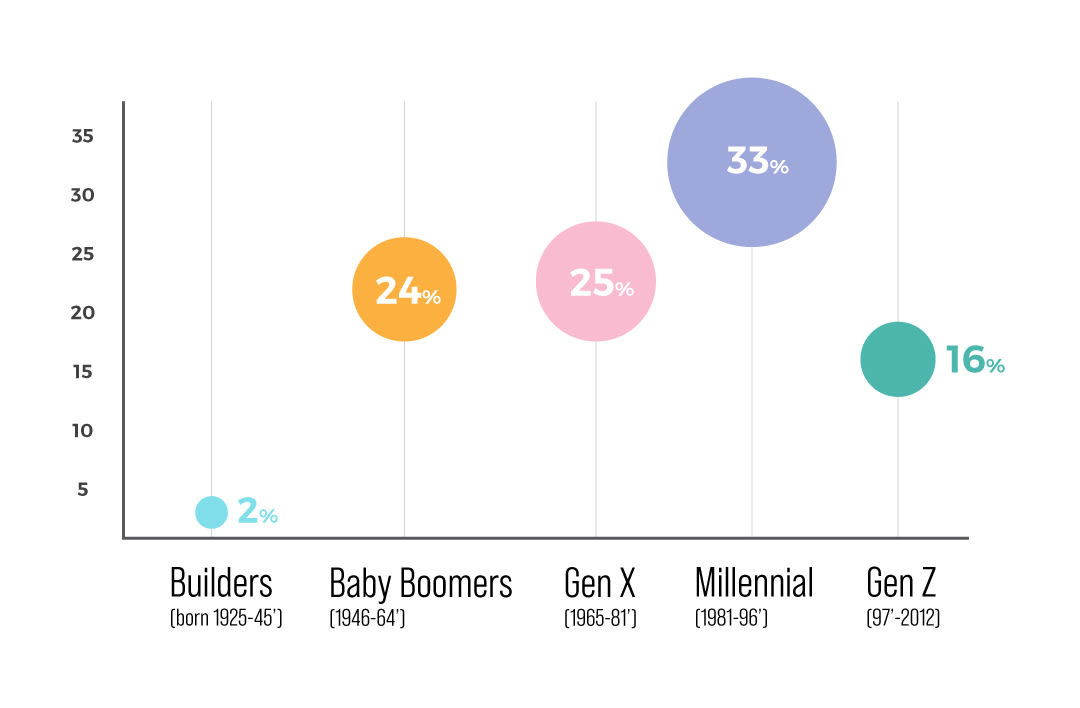
Excel comes prepared to handle any organization’s data visualization needs. Excel offers users an entire suite of data visualization tools to enhance and communicate data analysis in business. Some popular data visualization options in Excel are scatter charts, radar charts, stock charts, and pie charts, and users have access to many more.
The variety of data visualization tools offered by Excel is noteworthy because certain insights or data sets might be better served and emphasized by one format over another. Having access to a wide library of visualization formats allows business analysts to choose the format that fits their data the best.